Speeding up Postgres Queries by 200x with Analyze
I’ve been working on a growing series of services that archive, analyze, and represent data from a social network.
Part of this process involves archiving every post on a social network, running Computer Vision models on every image posted to the network, and running sentiment analysis on the text of every post on the network.
Exposition: Custom Feeds
I’ve built different services and patterns for generating this analysis data, but have recently been trying to produce custom feeds of posts based on analytic subgroups.
One such example is a “Cat Feed” which is a feed of all posts that contain pictures of cats (and sometimes not cats based on CV model accuracy).
Another example is a “Cluster Feed” which uses social cluster assignments of users on the platform to produce curated feeds authored by the members of a given cluster.
Producing these custom feeds requires building a View of the data in the database that conforms to numerous potential groupings: posts with cat pictures could be authored by someone in a particular cluster and we want both feeds to show such posts.
Aren’t Indices Enough?
The way I’m currently processing posts, some potential subgroups are defined by linking 2-3 tables together and filtering on one or more properties in the joined rows.
With indices, this shouldn’t be a problem, I’m creating BTrees that should make parsing through millions of rows a breeze, especially if I have lots of memory to spare.
Unfortunately, when I tried putting together a query to get the most recent posts authored by users in a given cluster, I was getting surprisingly poor performance:
Database Schema
The relevant tables for this post can be found below:
CREATE TABLE posts (
    id TEXT PRIMARY KEY,
    text TEXT NOT NULL,
    parent_post_id TEXT,
    root_post_id TEXT,
    author_did TEXT NOT NULL,
    created_at TIMESTAMPTZ NOT NULL,
    has_embedded_media BOOLEAN NOT NULL,
    parent_relationship CHAR(3),
    sentiment CHAR(3),
    sentiment_confidence FLOAT,
    FOREIGN KEY (author_did) REFERENCES authors(did)
);

CREATE TABLE author_clusters (
    author_did TEXT NOT NULL,
    cluster_id INT NOT NULL,
    PRIMARY KEY (author_did),
    FOREIGN KEY (author_did) REFERENCES authors(did),
    FOREIGN KEY (cluster_id) REFERENCES clusters(id)
);

CREATE TABLE clusters (
    id SERIAL PRIMARY KEY,
    lookup_alias TEXT UNIQUE NOT NULL,
    name TEXT NOT NULL
);
Oddly Slow Query
The query to grab a page of recent posts by authors in a common cluster is as follows:
SELECT p.id, p.text, p.parent_post_id, p.root_post_id, p.author_did, p.created_at,
       p.has_embedded_media, p.parent_relationship, p.sentiment, p.sentiment_confidence
FROM posts p
JOIN author_clusters ON p.author_did = author_clusters.author_did
JOIN clusters ON author_clusters.cluster_id = clusters.id
WHERE clusters.lookup_alias = 'some_cluster' AND
      p.created_at >= NOW() - make_interval(hours := 12)
ORDER BY p.id DESC
LIMIT 50;
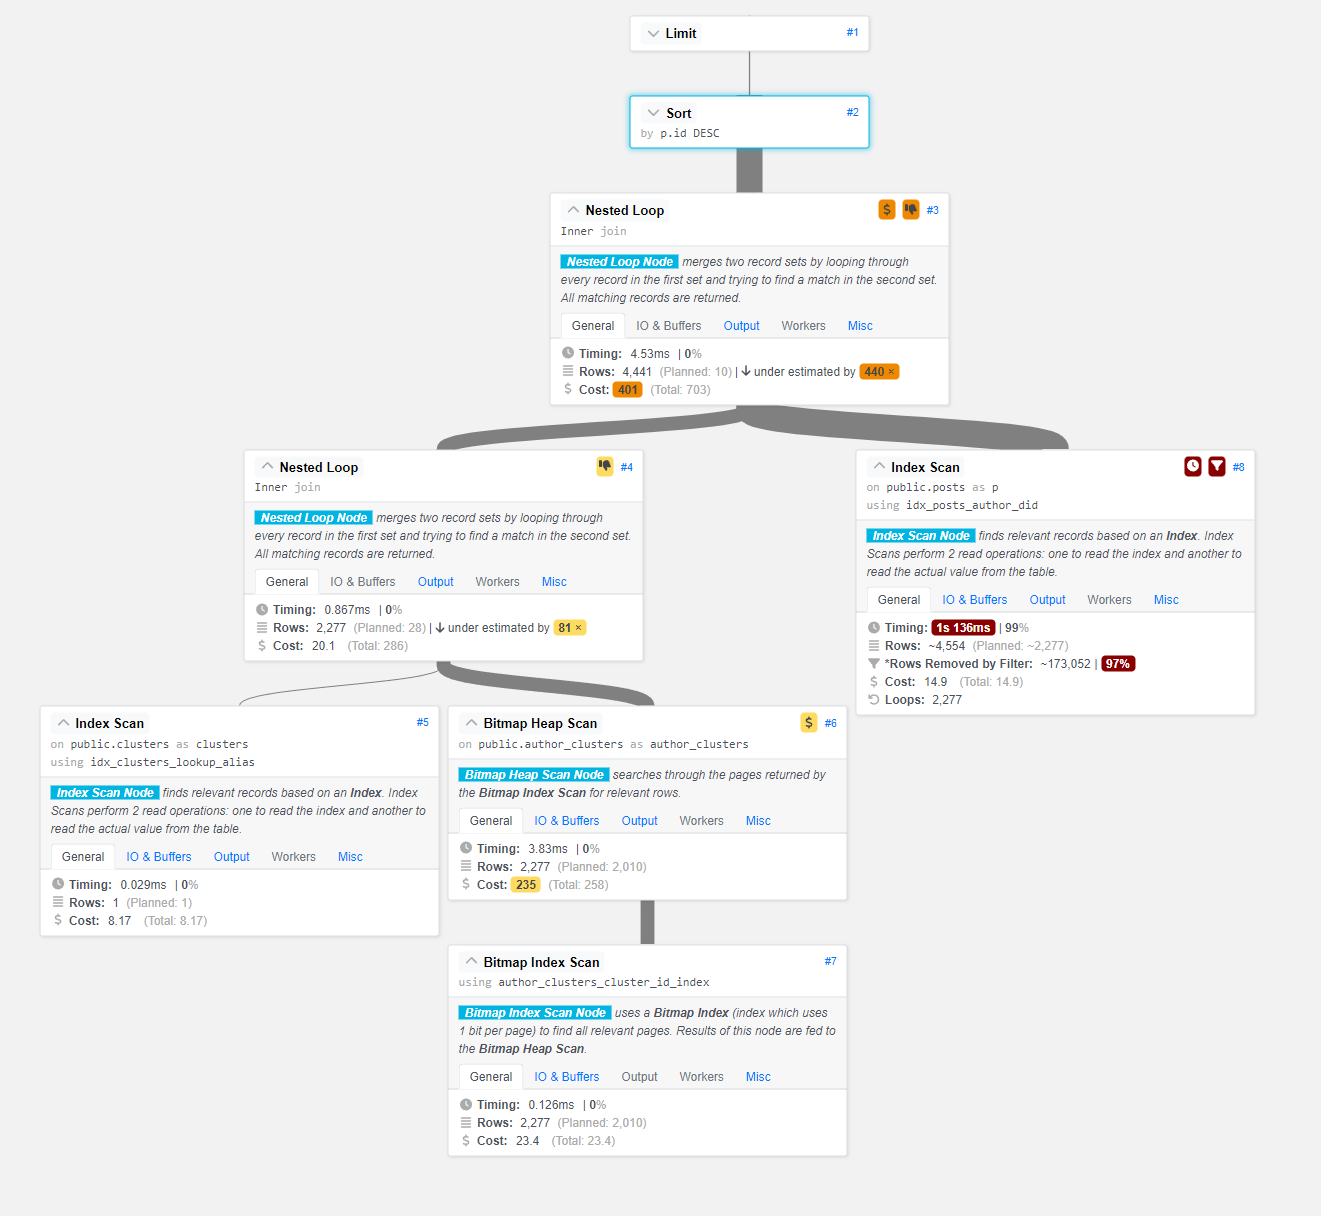
This query returned in 1.149s, which, given my posts table contains around ~2,000,000 rows and my author_clusters table contains around ~24,000 rows, seemed odd to me.
I have an index on cluster_id in author_clusters and an index on lookup_alias in clusters and an index on author_did, id, and created_at in the posts table, so what was going wrong?
Query Planning
To investigate, I wrapped my query in: EXPLAIN (ANALYZE, COSTS, VERBOSE, BUFFERS, FORMAT JSON) and went to the PostgreSQL Execution Plan Visualizer by Dalibo to debug the execution plan.
You can follow along as I walk through this plan here assuming these URLs remain stable.
The Culprit: The Query Planner
The tool here helpfully points out that Step #3, the first Nested Loop: Inner Join is heavily under-estimated and may be causing performance issues.
Okay, so what does it mean for a step to be “under-estimated”?
To find out, we need to learn a little bit about Postgres’s Query Planner.
You can find a deeper dive on the subject here but I’ll try to grab some snippets for you to read in brief.
The task of the planner/optimizer is to create an optimal execution plan. A given SQL query (and hence, a query tree) can be actually executed in a wide variety of different ways, each of which will produce the same set of results. If it is computationally feasible, the query optimizer will examine each of these possible execution plans, ultimately selecting the execution plan that is expected to run the fastest.
The planner/optimizer starts by generating plans for scanning each individual relation (table) used in the query. The possible plans are determined by the available indexes on each relation. There is always the possibility of performing a sequential scan on a relation, so a sequential scan plan is always created.
And critically:
All possible plans are generated for every join pair considered by the planner, and the one that is (estimated to be) the cheapest is chosen.
Table Statistics
Postgres uses an internal table called pg_statistic to keep track of some metadata on all tables in the DB.
These statistics include some important properties like a rough estimate of the number of rows in a table, an estimate of the distribution of data in the table, the most common values in each column, etc.
Postgres’s Planner uses these statistics when estimating the cost of operations, so when we see an “under-estimate” in our query plan, something is off in the pg_statistic table that could be causing the Planner to pick a suboptimal plan for our query.
A bad estimation, especially early in a query plan, can significantly degrade query performance.
Forcing Postgres to Update pg_statistic
pg_statistic is regularly updated when Postgres runs the AUTOVACUUM process, generally at certain breakpoints of activity (INSERTs, UPDATEs, and DELETEs) for a given table.
This process executes both a VACUUM which cleans up rows and indices, and an ANALYZE on the table which updates the contents of the pg_statistic data for the table.
While I was building out my dataset, I executed some queries that generated ~24,000 rows in the author_clusters relation in a few seconds. For some reason though, the AUTOVACUUM didn’t run and my table’s pg_statistic entry was sorely out of date: the Planner thought there were only ~50 rows in the table.
To trigger an update of pg_statistic manually for a table, we can run (on all three tables for good measure):
ANALYZE author_clusters;
ANALYZE posts;
ANALYZE clusters;
This can take some time depending on how large the tables are, but in my case the posts table of 2 million rows took less than 1 second to ANALYZE.
Results
After updating our table statistics, the query ran as expected in just about 5ms:
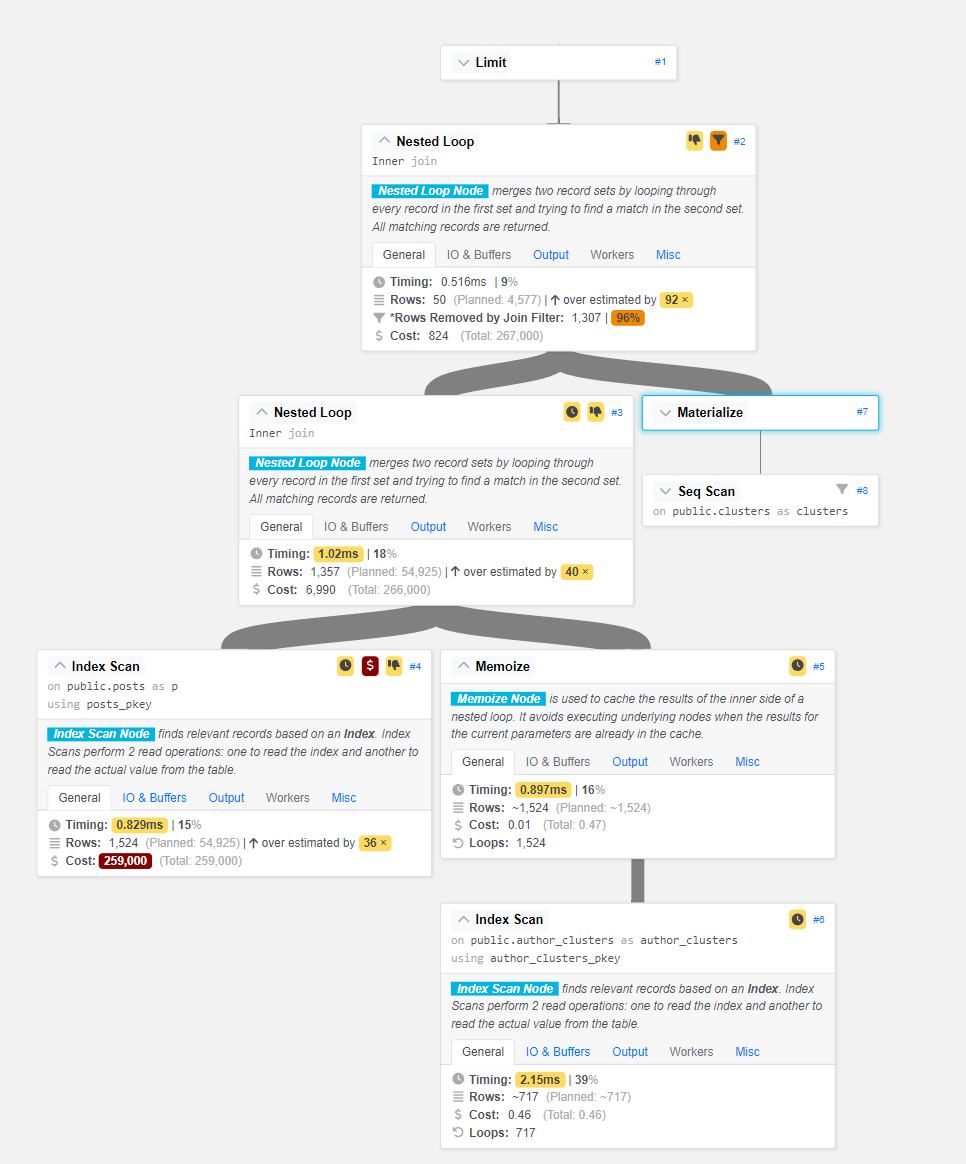
As you can see, the Planner is no longer grossly underestimating the first Nested Loop, and the performance of our query has increased dramatically.
The Query Plan Analyzer tool still has some poor performance to complain about, and I’ve still got more to learn about optimizing my DB queries. That being said, a speedup of ~207x for running one quick command is definitely noteworthy and has made my custom feeds a lot snappier.