Scaling Go to 192 Cores with Heavy I/O
For the past few months I’ve been working alongside Why, Jacob, Dan, and Divy on a new revision of Bluesky’s global AppView.
The AppView is a piece of infrastructure that aggregates posts, likes, follows, etc. from all across ATProto and merges them into a consistent view of the network, allowing users to fetch their timelines, notifications, custom feeds, etc.
This component requires an ability to scale horizontally with the amount of relevant records on the network. At time of writing, there are around 730,000,000 different records across three million users of the main PDS instances operated by Bluesky.
The first version of the AppView was a proof-of-concept Typescript service that sat in front of a large PostgreSQL instance and queried it on demand to satisfy requests from users.
This worked up to a point but eventually we had to spin up lots of DB replicas to query more frequently. Additionally our write throughput was capped to the vertical limits of a single DB instance.
To allow AppViewV2 to scale horizontally, we needed to build on top of a horizontally scalable database and have a better thought-out data layer between the AppView frontend API and the DB.
The V2 Dataplane
We chose to build the V2 Dataplane as a Go service on top of ScyllaDB and Redis.
We have a Scylla cluster running on our own hardware in a datacenter, along with a number of dense compute nodes for backend services.
Our Dataplane service runs on systems with 2x96 Core AMD Genoa-X CPUs with > 1GB of L3 Cache, 512GB of RAM, and as much on-board NVME storage as we need.
This Go service runs a ConnectRPC server and is a lightweight wrapper around ScyllaDB queries utilizing Go’s concurrency runtime and Scylla’s custom, shard-aware GoCQL driver.
During replayed real-world loads, our Dataplane service makes ~15.2 Scylla queries per request served, acting as a low latency fanout service for the Typescript frontend API.
Limits of Concurrency in Go
Go’s concurrency runtime scales very well in cloud applications.
Most Go application containers make a CPU request on a Kubernetes cluster somewhere, consume a couple vCPUs and some RAM, and do a great job of scaling as large as you’d reasonably make a K8s pod in production (something like 32vCPUs and 128GiB of RAM).
When running on baremetal, however, we found two key limitations of the Go runtime so far:
- Systems with a lot of RAM can have a lot of allocations, prompting the Go Garbage Collector to aggressively steal CPU.
- Applications performing hundreds of thousands of requests per second may make use of thousands of TCP sockets, bottlenecking the Go runtime’s network backend on syscalls.
Go Garbage Collection with Lots of RAM
If you’ve ever profiled a Go application and seen the runtime’s Garbage Collection routines using lots of CPU, first go read this incredible Go Dev post about how the GC works and how you can tune it.
When you’re done, if you have lots of RAM headroom, set GOGC=500 in your environment and try running your program again and see if it performs better.
Tune that number up and down (it defaults to 100) to find the right balance between CPU and RAM usage by the GC and you can also set GOMEMLIMIT=100GiB or whatever limit makes sense for your application to force GCs when the Go runtime hits the in-use memory limit.
When we tuned our Garbage Collector we saw a performance jump of around 2x on our hardware at the cost of ~3.2x RAM usage (in this case, from ~2.5GB -> ~8GB), with a significant dip in CPU usage and huge reduction in p99 latencies for simple in-memory operations like reading from an in-memory cache.
Go Runtime Concurrency Limits - EPoll and Sockets
Go’s network backend uses an EPoll-based system called Netpoll.
Netpoll handles the network-related syscalls on your Go program’s behalf and has lots of optimizations to keep your program fed with fresh bytes.
Our Dataplane service makes two connections to each ScyllaDB Shard in our cluster: one for reads and one for writes to allow for different consistency tuning.
For a sufficiently large ScyllaDB cluster this easily baloons into >1,500 TCP connections on the Go application host. On top of that, we’ve got connections from our clients over TCP as well, sometimes numbering in the thousands of sockets too.
The Netpoll implementation calls EPoll and grabs a chunk of “ready” sockets all in one go.
In most cases with smaller machines, a few dozen sockets may become available simultaneously and thus Netpoll can grab them and make use of them in the span of a single syscall, granting more execution time to the Go runtime and your app.
On our large systems, however, we make hundreds of thousands of requests that take less than 1 millisecond to our ScyllaDB cluster every second across thousands of TCP sockets. So in a given EPoll call, there may be a thousand or more TCP sockets ready to be picked up by our application.
Unfortunately, Netpoll only buffers at most 128 sockets in a single EPoll call, meaning we’re stuck making several EPoll calls in order to fetch all the sockets becoming available.
In a CPU profile, this manifests as nearly 65% of our CPU time being spent on syscall.EpollWait in runtime.netpoll!
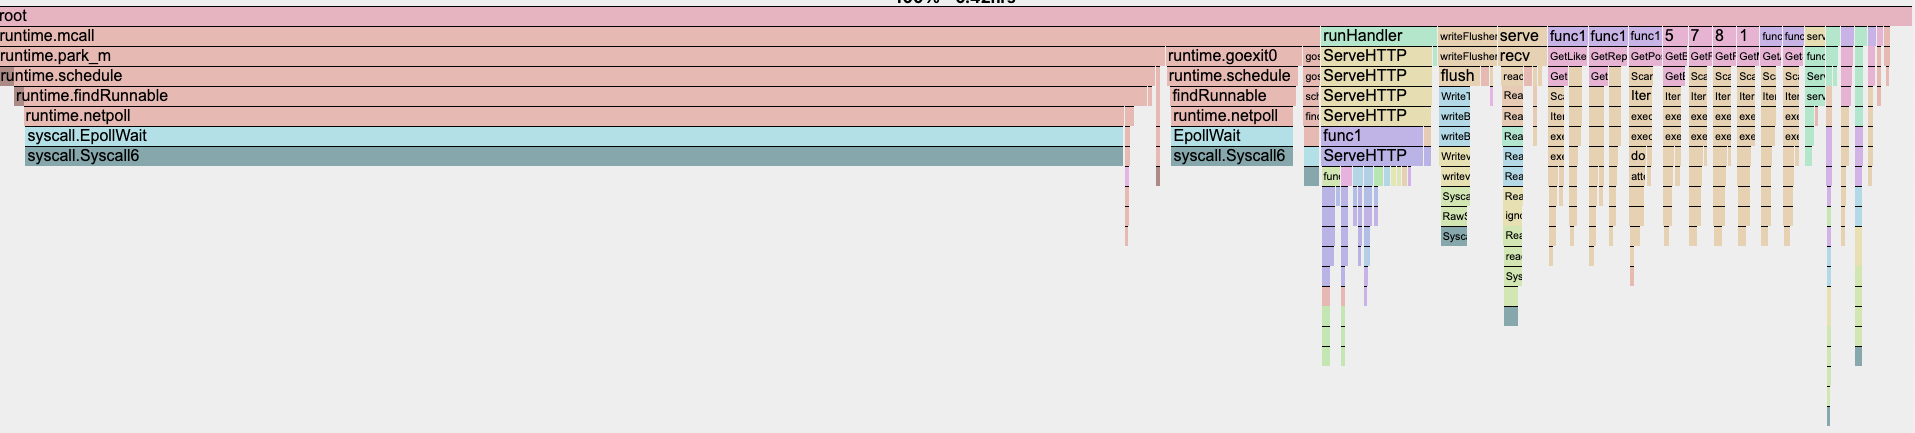
As it turns out, this becomes a significant bottleneck for scaling I/O heavy Go applications and results in very poor application performance when running a single Go binary at massive vertical scale.
Resolving the Netpoll Epoll Dilemma
To resolve this issue, the solution is quite apparent: we need to run a larger number of Go runtimes per host and reduce their individual network I/O workloads to something the Go runtime can manage.
Thankfully, in our case, this was as easy as spinning up 8 application containers per host on different ports (skipping Docker NAT) and pointing our Typescript Frontend API at the additional addresses to route its requests.
After implementing this change, we saw a 4x increase in performance.
From a previous maximum throughput of ~1.3M Scylla queries per second across 3 containers on 3 hosts, we see a new maximum of ~2.8M Scylla queries per second (for now) across 24 containers on 3 hosts.
From a previous maximum throughput of ~90K requests served per second to the AppView Frontend, we saw a jump to ~185k requests served per second.
Our p50 and p99 latencies dropped by more than 50% during load tests, and at the same time the CPU utilization on each Dataplane host saw a reduction from 80% across all cores to under 40% across all cores.
This find finally allows us to get the full performance out of our baremetal hardware and will let us scale out much more effectively in the future.
If you’re interested in solving problems like these, take a look at our open Backend Developer Job Rec.
Update
The syscall.EpollWait bottleneck is now being investigated in a Go Issue so hopefully we might see some improvement in the future!